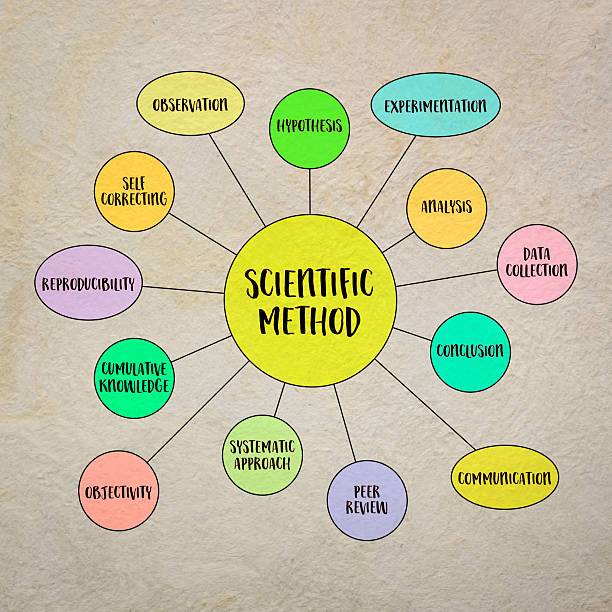
Presenting research findings is one of the most important stages of any academic research project. After spending weeks or months selecting a topic, reviewing literature, collecting data, and analyzing results, researchers must communicate their findings clearly and professionally.
Many undergraduate students struggle with this stage because they are unsure how to organize their results, interpret statistical output, or explain what the findings mean. Some simply copy tables from statistical software without explanation, while others include unnecessary information that confuses readers.
Learning how to present research findings effectively helps readers understand the results of a study and demonstrates the researcher's ability to interpret data accurately. Whether your study is quantitative or qualitative, your findings should be presented logically, objectively, and in a way that directly addresses your research objectives.
This guide explains the best practices for presenting research findings in undergraduate projects, theses, dissertations, and academic reports.
What Are Research Findings?
Research findings are the results obtained after analyzing collected data.
They answer the research questions and provide evidence for the conclusions of the study.
Depending on the research design, findings may include:
Statistical tables.
Charts and graphs.
Themes from interviews.
Observational results.
Hypothesis testing.
Descriptive summaries.
Research findings should be based on evidence rather than personal opinions.
Why Presenting Research Findings Is Important
A well-presented findings chapter helps readers:
Understand the results of the study.
See how the research objectives were achieved.
Evaluate the credibility of the research.
Compare findings with previous studies.
Draw meaningful conclusions.
Poor presentation can make even a well-conducted study appear weak.
Where Research Findings Appear in a Research Project
In most undergraduate research projects, research findings are presented in Chapter Four.
Chapter Four generally includes:
Introduction.
Demographic information.
Presentation of research questions.
Hypothesis testing (where applicable).
Interpretation of findings.
Summary of results.
The exact structure may vary depending on institutional guidelines.
Step 1: Organize Your Findings Before Writing
Before writing Chapter Four, organize your results carefully.
Arrange the findings according to:
Research objectives.
Research questions.
Hypotheses.
Variables.
Avoid presenting information randomly.
A logical structure makes the chapter easier to read.
Step 2: Present Respondent Demographics
Many quantitative studies begin by describing the characteristics of respondents.
Typical demographic variables include:
Gender.
Age.
Educational qualification.
Occupation.
Years of experience.
Department.
These characteristics are usually presented using:
Frequency tables.
Percentages.
Pie charts.
Bar charts.
Example:
|
Gender |
Frequency |
Percentage |
|
Male |
70 |
58.3% |
|
Female |
50 |
41.7% |
|
Total |
120 |
100% |
After each table, explain the key observation rather than simply repeating every number.
Step 3: Present Findings Based on Research Questions
One of the best ways to organize Chapter Four is by following the research questions.
For each research question:
Present the relevant data.
Include tables or charts if necessary.
Explain the results.
Highlight important observations.
This approach creates a clear connection between the study's objectives and findings.
Step 4: Use Tables Correctly
Tables are useful for organizing numerical information.
Every table should include:
Table number.
Descriptive title.
Clearly labeled rows and columns.
Source (if required).
Example:
Table 4.2: Respondents' Satisfaction with Online Learning
A well-designed table should be easy to understand without unnecessary complexity.
Avoid overcrowding tables with excessive information.
Step 5: Use Charts and Graphs Appropriately
Visual presentations make findings easier to understand.
Common charts include:
Bar charts.
Pie charts.
Line graphs.
Histograms.
Choose the chart that best represents the data.
For example:
Pie charts are suitable for percentages.
Bar charts compare categories.
Line graphs show trends over time.
Do not use charts simply for decoration.
Each chart should support the discussion.
Step 6: Interpret Every Result
One of the biggest mistakes students make is inserting tables without explaining them.
Every result should be interpreted.
For example:
Instead of writing:
"The mean score was 4.12."
Explain what it means:
"The average satisfaction score of 4.12 suggests that respondents generally expressed a positive opinion regarding the quality of customer service."
Interpretation helps readers understand the significance of the findings.
Step 7: Present Hypothesis Testing Clearly
If your study includes hypotheses, present each test systematically.
Include:
The hypothesis.
Statistical test used.
Test results.
Decision.
Interpretation.
Example:
Hypothesis One
"There is no significant relationship between employee training and job performance."
After presenting the statistical output, explain whether the hypothesis was accepted or rejected based on the significance level.
Avoid presenting statistical values without explanation.
Step 8: Maintain Objectivity
The findings chapter should present results objectively.
Avoid:
Personal opinions.
Emotional language.
Unsupported assumptions.
The discussion and interpretation should be based entirely on the collected data.
Step 9: Present Qualitative Findings Effectively
Qualitative research findings are presented differently from quantitative findings.
Instead of statistical tables, researchers often organize findings into themes.
Example:
Theme 1: Lack of Digital Infrastructure
Participants reported that poor internet connectivity affected online learning.
Theme 2: Limited Access to Devices
Several participants indicated that they shared mobile devices with family members, limiting participation in online classes.
Supporting quotations may be included where appropriate, but they should be relevant and concise.
Step 10: Link Findings to Research Objectives
Every major finding should contribute to answering one or more research objectives.
Students should regularly ask:
Does this result answer my research question?
Does it help achieve my research objective?
If not, it may not belong in the findings chapter.
Common Mistakes Students Make
Many undergraduate students make similar mistakes when presenting findings.
Copying SPSS Output Directly
Statistical software produces useful output, but researchers should present only relevant results.
Large blocks of raw output should not replace proper presentation.
Repeating Numbers Without Interpretation
Readers should not be left to interpret tables independently.
Always explain the meaning of important results.
Including Irrelevant Information
Every table, chart, and discussion should support the research objectives.
Remove unnecessary information that does not contribute to the study.
Mixing Findings with Recommendations
Recommendations belong in the final chapter rather than the findings chapter.
Chapter Four should focus on presenting and interpreting results.
Poor Table Formatting
Tables should be neat, properly numbered, and consistently formatted throughout the document.
Tips for Presenting Research Findings Effectively
Students can improve their findings chapter by:
Organizing results logically.
Following the research questions.
Using clear tables and charts.
Explaining every result.
Avoiding unnecessary repetition.
Remaining objective.
Connecting findings to research objectives.
A well-written findings chapter demonstrates analytical skills and improves the overall quality of the research.
How ProjectAndResearch.com Can Help
Many students struggle with Chapter Four because they are unsure how to interpret statistical output, organize results, or present findings professionally.
ProjectAndResearch.com provides expert assistance with:
Chapter Four writing.
SPSS data analysis.
Statistical interpretation.
Research methodology.
Questionnaire design.
Academic project writing.
Research consultation.
Whether you are working on an undergraduate project, dissertation, thesis, or journal article, professional guidance can help you present your research findings clearly and confidently.
Conclusion
Knowing how to present research findings effectively is an essential skill for every undergraduate researcher.
A strong findings chapter should present data clearly, organize results logically, interpret every table and chart, and maintain a direct connection to the research objectives.
Whether your study uses quantitative statistics or qualitative themes, effective presentation helps readers understand your findings and increases the credibility of your research.
By applying the principles discussed in this guide, students can produce professional Chapter Four presentations that clearly communicate the value of their research and contribute to stronger academic performance.