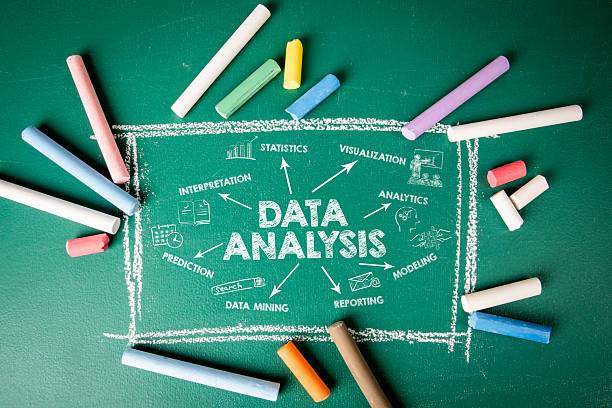
Data analysis is one of the most important stages of any research project. After collecting data through questionnaires, interviews, observations, or experiments, researchers must organize and examine the information to answer their research questions and draw meaningful conclusions.
For many undergraduate students, data analysis appears difficult because it often involves numbers, tables, charts, and statistical concepts. However, data analysis is simply the process of transforming raw information into useful knowledge that can support decision-making and answer research questions.
Whether you are conducting research in Business Administration, Economics, Education, Computer Science, Public Administration, Sociology, Marketing, Nursing, or Engineering, understanding data analysis for beginners is an essential academic skill.
This guide introduces the fundamentals of data analysis, explains its importance, discusses common analysis methods, and provides practical tips for beginners.
What Is Data Analysis?
Data analysis is the process of inspecting, organizing, interpreting, and presenting collected data to answer research questions or solve problems.
In research, data analysis helps researchers:
Identify patterns.
Compare results.
Test hypotheses.
Draw conclusions.
Make recommendations.
Without proper analysis, collected data has little practical value because it remains as unorganized information.
Why Is Data Analysis Important?
Data analysis plays a vital role in academic research because it helps researchers:
Understand collected information.
Identify trends and relationships.
Answer research questions.
Support research findings with evidence.
Make objective conclusions.
Proper data analysis improves the credibility and reliability of research findings.
Types of Data Used in Research
Before analyzing data, researchers should understand the type of data they have collected.
Quantitative Data
Quantitative data consists of numerical information.
Examples include:
Age.
Income.
Examination scores.
Sales figures.
Population statistics.
Customer ratings.
Quantitative data is usually analyzed using statistical methods.
Qualitative Data
Qualitative data consists of non-numerical information.
Examples include:
Opinions.
Experiences.
Interview responses.
Observations.
Personal stories.
Qualitative data focuses on understanding meanings, behaviors, and experiences rather than measuring numbers.
The Data Analysis Process
Although different studies may use different approaches, the data analysis process generally follows several important steps.
Step 1: Define the Research Objectives
Before analyzing data, researchers should clearly understand:
The research objectives.
Research questions.
Research hypotheses (if applicable).
The analysis should directly address these objectives.
Step 2: Organize the Data
Collected information should be organized carefully.
For quantitative studies, this may involve entering data into software such as:
Microsoft Excel.
IBM SPSS Statistics.
Stata.
R.
For qualitative studies, interview recordings may need to be transcribed and organized.
Step 3: Clean the Data
Data cleaning involves identifying and correcting problems in the dataset.
Researchers should check for:
Missing values.
Duplicate records.
Incorrect entries.
Typographical errors.
Inconsistent responses.
Clean data leads to more accurate analysis.
Step 4: Classify the Data
Researchers often classify information into meaningful categories.
For example:
Age Groups:
18–25
26–35
36–45
Above 45
Income Levels:
Low
Medium
High
Classification helps simplify analysis and presentation.
Step 5: Analyze the Data
The analysis method depends on the type of research.
Quantitative studies often involve statistical analysis.
Qualitative studies often involve identifying themes and patterns.
Descriptive Data Analysis
Descriptive analysis summarizes collected information.
Common descriptive statistics include:
Frequency.
Percentage.
Mean.
Median.
Mode.
Standard deviation.
For example, descriptive analysis may answer questions such as:
How many respondents were male?
What was the average age?
Which response was most common?
Descriptive statistics provide a general overview of the data.
Inferential Data Analysis
Inferential statistics help researchers make conclusions about a larger population based on sample data.
Common inferential techniques include:
T-test.
ANOVA.
Correlation analysis.
Regression analysis.
Chi-square test.
These methods help researchers examine relationships between variables and test research hypotheses.
Qualitative Data Analysis
Qualitative analysis focuses on understanding ideas, experiences, and meanings.
Researchers often:
Read interview transcripts.
Identify recurring themes.
Group similar responses.
Interpret participant experiences.
Rather than focusing on numbers, qualitative analysis seeks to explain why certain behaviors or opinions exist.
Common Data Analysis Tools
Researchers use different software applications depending on the study.
Popular tools include:
Microsoft Excel
Useful for:
Basic calculations.
Charts.
Tables.
Simple statistical summaries.
IBM SPSS Statistics
Widely used for quantitative research.
Suitable for:
Survey analysis.
Descriptive statistics.
Hypothesis testing.
Regression analysis.
R Programming
Popular among researchers who require advanced statistical analysis.
Stata
Commonly used in economics, public health, and social science research.
NVivo
Designed for qualitative data analysis.
Useful for organizing interview transcripts and identifying themes.
Common Mistakes Beginners Make
Many students make avoidable mistakes during data analysis.
Analyzing Data Without Clear Objectives
Analysis should answer the research questions rather than simply produce statistics.
Choosing the Wrong Statistical Test
Different research questions require different analytical methods.
Selecting the wrong statistical technique can produce misleading conclusions.
Ignoring Data Cleaning
Errors in data entry can significantly affect research findings.
Always clean the data before analysis.
Misinterpreting Results
Researchers should understand what statistical results actually mean.
Numbers should always be interpreted in relation to the research objectives.
Presenting Tables Without Explanation
Every table or chart should be accompanied by a clear explanation.
Readers should not be expected to interpret statistical results independently.
Tips for Beginners
Students who are new to data analysis should:
Understand the research objectives.
Learn the basics of statistics.
Organize data carefully.
Use appropriate software.
Practice interpreting results.
Present findings clearly.
Seek guidance when necessary.
Data analysis becomes easier with practice and experience.
Data Analysis in Undergraduate Research
Most undergraduate research projects include a chapter dedicated to presenting and interpreting findings.
This chapter often contains:
Respondent demographics.
Descriptive statistics.
Hypothesis testing.
Discussion of findings.
Students should ensure that every analysis directly supports the research objectives.
Why Data Analysis Skills Matter
Data analysis is valuable beyond academic research.
Many organizations rely on data to make business decisions.
Professionals with data analysis skills are in demand in areas such as:
Marketing.
Banking.
Healthcare.
Education.
Government.
Business consulting.
Technology.
Developing these skills can improve both academic performance and career opportunities.
How ProjectAndResearch.com Can Help
Many students find data analysis challenging because it requires both technical knowledge and an understanding of research methodology.
ProjectAndResearch.com provides professional support in:
Research methodology.
SPSS data analysis.
Statistical interpretation.
Chapter Four writing.
Questionnaire design.
Research consultation.
Academic writing.
Whether you are working on an undergraduate project, dissertation, thesis, or research paper, expert guidance can help improve the quality of your analysis and overall research.
Conclusion
Understanding the introduction to data analysis for beginners is an important step toward conducting successful academic research.
Data analysis helps researchers organize information, identify patterns, test hypotheses, and make evidence-based conclusions. Whether using descriptive statistics, inferential statistics, or qualitative analysis, the goal is to transform raw data into meaningful insights.
For undergraduate students, mastering the basics of research data analysis not only improves the quality of academic projects but also develops analytical skills that are highly valuable in today's data-driven world.
With continuous learning, practice, and the right guidance, beginners can confidently analyze research data and produce credible, well-supported research findings.